Heavy Rain, Flooding, and Chance of Severe Weather Staring Down the Southern U.S.
January 22, 2024
Posted: June 9, 2023 9:30 am


Now that the Atlantic hurricane season is officially underway, many residents in potential impact zones are taking the time to learn more about these tropical events.
The more that you understand about these powerful forces of Mother Nature, the better prepared that you will be to prepare for their impacts. One of the most important indexes used by the National Hurricane Center (NHC) to measure a storm’s intensity is what is known as the Accumulated Cyclone Energy (ACE) number.
Read on for more information about the ACE and how it can help predict the potential impact of a tropical storm or hurricane.
The ACE index is used by experts to measure both the intensity and the general activity of tropical events throughout the season. The metric was first introduced at Colorado State University in the 1990s as a means to measure the potential of a given hurricane season.
The ACE index calculates the intensity and the duration of every named storm. These numbers can then be used to compare storms and overall seasons to each other.
The assigned values can help experts understand each individual storm while also determining how active the current season may be when compared to past seasons. This value can also be used to determine the threat of potential impacts with land and how life-threatening a tropical event may become.
Like most tropical feature measuring tools, the ACE metric looks closely at maximum sustained winds. This calculation is typically measured every six hours when an event takes on the designation of a tropical storm. The measurement will keep happening at this interval as long as it remains active.
These values are then added up over the course of the season to provide a complete picture of the total activity in the basin.
The average ACE numbers depend on the basin that is measured. For instance, the 30-year ACE value for the North Atlantic basin averages out to 123 units. This number jumps to 132 units when measured in the East Pacific basin. Conversely, the hyper-active West Pacific basin has a 30-year ACE average of 298 units.
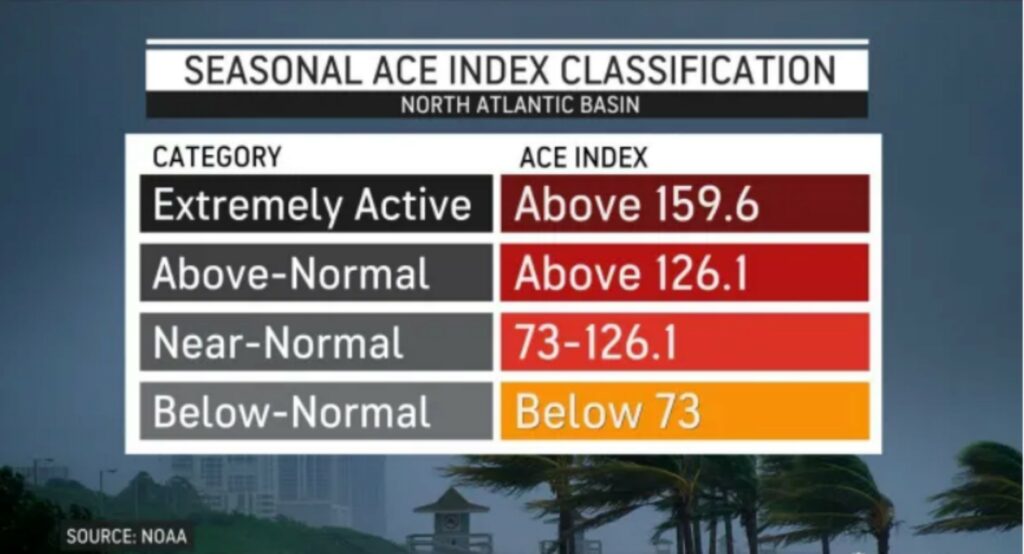
Most of the U.S. is impacted primarily by the activity in the Atlantic basin. The long-term average value for this part of the ocean is 96 units. A below normal season features an ACE index of less than 73 units while an exceptionally active season would come in at above 159 units.

Higher ACE values are associated with more intense and active hurricane seasons when compared to seasons with lower indexes. This holds true even if the different seasons feature the same number of named tropical events.
For instance, the 2013 Atlantic hurricane season churned up 14 named storms, just slightly above the normal amount. But because only two of these 14 storms hit the designation of a hurricane, the season only had a final ACE value of just 36.1 units.
Adding to this lower index was the fact that only three of the named storms hung on for five days or longer. Thus, the relative weakness of the named storms paired with the short durations translated to a lower ACE unit even though the season featured a higher number than average events.
Conversely, the 1998 Atlantic season also featured 14 named storms. However, 10 of these 14 events went on to turn into hurricanes with three of them reaching the status of a major hurricane defined as Category 3 or higher.
This included Hurricane Georges that hit a strength of a Category 4 as it caused extensive damage across the Caribbean. Hurricane Georges was blamed for over 600 deaths.
In addition, the 1998 season saw Hurricane Mitch reach a Category 5 status, claiming the lives of over 11,000 people. The worst of the damage from Mitch happened in Nicaragua and Honduras.
The season finished up with an ACE value of 181.8 units, nearly double the amount of a normal season in this part of the Atlantic.
Heading into the 2023 Atlantic season, hurricane experts will be paying close attention to this predictive metric. As of now, forecasters are predicting a near average season as it relates to the number of named storms.
Did you find this content useful? Feel free to bookmark or to post to your timeline for reference later.

January 21, 2024

January 19, 2024

January 18, 2024